The paper behind this story
The Painful Price of Security
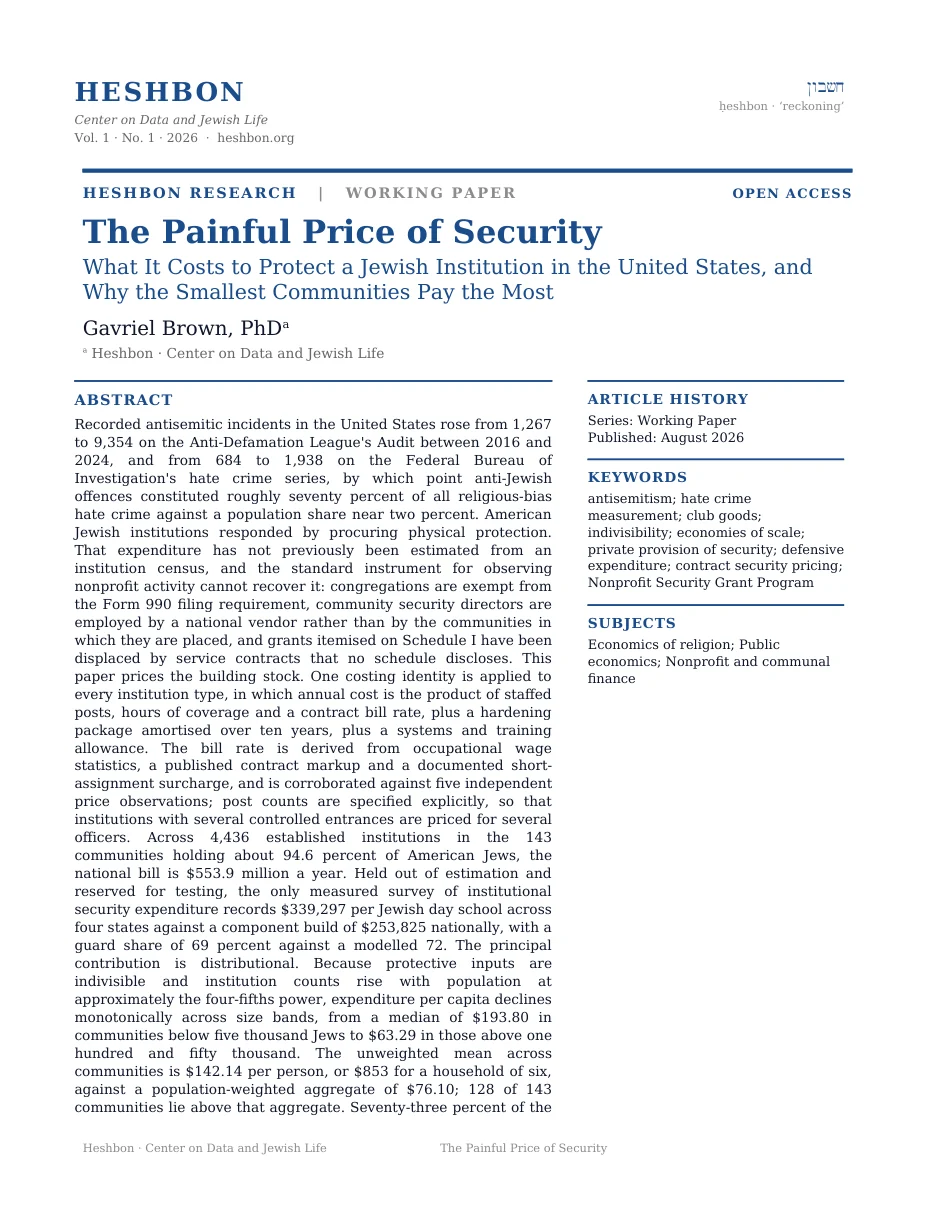
Request the full white paper
Tell me who you are and where you work. I’ll send the complete paper.
Sent to the author directly. No list, no forwarding, no third parties.
That is what their community spends on guards, cameras, doors and security staff divided by the people it protects, in the average American Jewish community. In the forty-three communities with fewer than five thousand Jews the median family costs $1,163. In 2016 it was $94.
Nobody sends that bill. It arrives folded into synagogue dues, into day school tuition, into the federation campaign letter, into a JCC membership. Add it up and the security line runs a family of six $853 a year, and no one in that family ever sees an invoice for it.
We got there by counting buildings. Every established synagogue, day school, community centre, camp, campus building, elder care home and family service office in the 143 American Jewish communities with two thousand people or more, priced one at a time, then divided by the Berman population count for each community and averaged across all 143.
What does it cost to protect one Jewish family for a year?
Each bar below is a group of communities sorted by how many Jews live in them, smallest group at the top. The length of the bar is the median community in that group: its annual security bill divided by the people it protects, times six. The dashed vertical line is $853, the average across all 143 communities.
Watch the bars shrink as the towns get bigger.
Median annual security cost for a family of six, by community size
The two numbers answer different questions. The aggregate answers what American Jewry spends per head. The average of the communities answers what a Jewish community spends per head, and that is the figure a federation director or a school finance committee actually lives with. A family in Reading, Pennsylvania pays 5.4 times what the same family pays in New York for the same protection.
Where does that number come from?
It comes from buildings. Each bar below is one kind of Jewish institution, and its length is the total annual cost of securing every one of them in the country. Blue bars are buildings. The single rust bar is the layer that sits above the buildings: Secure Community Network, Community Security Service, and the community security directors placed in local communities.
Look at how far the top bar runs past everything under it.
Modelled annual security cost by institution type, 2024, millions of dollars
About 250,000 children attend Jewish day school, roughly three percent of American Jews, and their schools carry $241M of a $554M national bill. That works out to about $965 per student a year. American public schools spend about $250. A family paying day school tuition is paying nearly four times the public rate for security on top of the tuition, and New Jersey reimburses $75 of it.
Seventy-three percent of the whole bill is people rather than hardware: $407M for guards and security staff, $94M for amortised hardening, $53M for systems and training. You buy a camera once. A guard is a payroll line that arrives every Friday afternoon for as long as the threat lasts.
Why does the average community pay nearly twice the national rate?
Each dot below is one community. Its position left to right is how many Jewish people live there, on a scale where each step multiplies by ten, so Binghamton at 2,400 and New York at 1.5 million can sit on the same page. Its height is the annual security cost per person. The dashed horizontal line is the $142 average. Dots above the line are communities paying more than the average, dots below it are paying less.
Follow the dots from right to left and watch them climb.
143 communities with a Jewish population of 2,000 or more
A community of two thousand still needs a synagogue, and the synagogue still needs someone at the door on Shabbat morning. It cannot buy a third of a guard. Institution counts in this data rise with population at roughly the four-fifths power. In plain terms, a community ten times larger has about six times the buildings, not ten. Spread six times the cost across ten times the people and the figure per person falls by a third. Repeat that up the size ladder and you get the slope on this chart.
Is that slope real, or is it an artefact of the model?
It is real, and here is the part that is not modelled at all. Each dot below is one federation that disclosed a security director's pay on its tax return. Its position is that actual disclosed salary divided by the actual Jewish population of the community it serves. Nothing here is estimated. The hollow dot at the far left is New York, which discloses no security officer, placed at what the median salary would cost it.
Hold the top and bottom numbers side by side.
Disclosed security director salary per Jewish person in the catchment, fiscal year 2024
Now set that salary against everything else a community spends on security. In communities under five thousand people the security director alone is 27 percent of the whole local security bill. Above a hundred and fifty thousand, the same job is 1 percent of it. Measured against what a small federation actually raises, it gets worse: one security director at the median salary would take 30.3 percent of every dollar the Binghamton federation collects in a year. Madison is 11.1 percent, Dayton 7.4. At UJA-Federation of New York the same salary would be four hundredths of one percent.
What did this cost before?
The two solid bars below are the answer: what the average community spent per Jewish person on security in 2016, in today's money, and what it spends now. The three faint bars underneath are the same 2016 figure calculated at three faster growth rates, and they are there to show that the conservative choice produces the smallest rise, not the largest.
Notice that every alternative makes the increase bigger, not smaller.
Annual security cost per Jewish person, average community, constant 2024 dollars
One piece of this is measured rather than modelled. The Teach Coalition surveyed 63 Jewish day schools twice. Mean annual security spending went from $184,228 a school in 2022 to 2023 to $339,297 in 2024 to 2025, up 84 percent in two years, and reached 3.09 percent of school budget and $807 a pupil, with 69 percent of it going to guards. Over those same two years Secure Community Network's spending rose 86 percent and federation grants to security organisations fell. Where we can check the buildings directly, they moved faster than the federations did. That is the reason to treat $15.62 as a ceiling on 2016 rather than a best guess.
If communities are paying this, why can you not see it in the giving data?
All three lines below start at 100 in 2016, so they are measuring growth rather than size, and the vertical scale multiplies by ten at each label, so a steeper line means faster growth. The blue line is what every federation in America granted to dedicated security organisations. The rust line is what Secure Community Network actually spent. The green line is federal money reaching Jewish institutions.
Follow the blue line to 2022, where it peaks, then watch it fall while the other two keep climbing.
Indexed to 2016 = 100, logarithmic scale
The staffing tells the same story twice. The Jewish Federations of North America counted 42 federations with a security director in November 2021 and roughly 130 communities with a staffed initiative by 2025. The federations' own tax returns show three in 2018 and thirteen in 2024. Both counts are correct. The directors mostly work for Secure Community Network and are placed in communities under service agreements, so roughly a hundred and thirty communities' worth of staff appear on one Form 990. Of the 81 federations that took LiveSecure money in 2024, 63 have never reported a security officer of their own.
So who is actually paying?
The two bars below are annual dollars. The blue bar is what the whole American Jewish community spends each year on physical hardening, meaning cameras, doors, bollards and ballistic film spread across their useful life. The rust bar is what the federal Nonprofit Security Grant Program sent to Jewish institutions in fiscal 2024.
Compare the two lengths.
Annual dollars, 2024, millions
Which means the recurring seventy-three percent of Jewish communal security now rests on an annual congressional appropriation. That appropriation fell 39 percent in fiscal 2025 and the awards arrived nearly a year late, after the following year's application deadline had already passed. Twenty-seven percent of applicants got anything.
The rest is the community's own money, and that is where the burden in Exhibit 1 lands. Strip out the federal and state reimbursement and American Jews are still writing roughly $169M a year of their own cheques for guards and doors, on top of everything a Jewish community was already paying for.
So: what does it cost to keep an American Jewish family of six secure for a year? About $853 in the average community, $840 in the median one, and $1,163 in the forty-three communities with fewer than five thousand Jews. Nine years ago the same family cost $94.
We stand behind those numbers. Every line in the bill is built the same way, from the same three terms: officer hours at a $45 bill rate derived from labour statistics, a hardening package spread over ten years, and a systems and training line. The rate is consistent with the $90,000 fully loaded guard-year the Jewish Federations of North America reported to Congress, and the coverage schedule behind every hour is written down where a reader can argue with it. Nothing is imported from a survey.
Then we tested it against the one survey we deliberately kept out. The Teach Coalition measured $339,297 a year at 63 day schools across New York, New Jersey, Pennsylvania and Florida. Our national build, which never saw that number, says $253,825. Seventy-five percent of the measured figure, from a model that never saw the number. The composition matches too: guards are 72 percent of the modelled cost against 69 percent measured. Two readings of the gap are available and we give both. The national figure should sit below a four-state figure whose own state means run from $82,500 in Pennsylvania to $287,081 in New York. Or our coverage is light: the measured guard spending implies 5,203 officer-hours a school where we assume 4,085, which is about one more post through the school day. Since the survey is held out, that is a finding about the model rather than a knob we turned.
JFNA told Congress in July 2025 that the national figure is $765 million, built a completely different way, from a facility count rather than an institution census. Our build reaches $554 million across 4,436 established institutions, which is $124,865 each; theirs runs over the more than 13,000 facilities the Secure Community Network monitors, which is $58,846 each. The two are reconcilable, and the gap between them is scope rather than price. Their larger count takes in Chabad houses, kosher retail, communal offices and cemeteries, and those sites carry far lower unit costs than the buildings priced here.
What the number means is harder. Seven hundred and fifty-nine dollars a year has been added to the cost of one Jewish family of six since 2016, and it buys nothing anyone wanted. It does not fund a school, a scholarship, a rabbi, a meal, a burial, a bed in a nursing home. It pays somebody to stand outside a door.
And it lands hardest where there is least to carry it with. The communities paying $1,163 a family are the ones with one synagogue, one school, an aging JCC and a campaign of two million dollars. One security director would cost Binghamton thirty percent of everything it raises in a year. Reading pays 5.4 times what New York pays per person, and Grand Rapids pays 5.9 times. These are the communities already losing people to the coasts, already merging institutions, already asking whether the day school survives another decade, and their security bill is the steepest in the country.
Federal money hides a good deal of this, and federal money is now an annual appropriation that fell by 39 percent in one year and arrived late. Nothing in the last three years suggests the guard at the door goes home. The question American Jewish communities have not answered out loud is what they intend to stop doing in order to keep paying him.
Scope. Established institutions only: congregations with a building, paid staff and a security line. Shtieblach, storefront minyanim and small Chabad houses are excluded, because they run volunteer or do-it-yourself security rather than hiring guards. That removes roughly 1,520 congregations and about $25M. Community Security Service alone trains more than 7,100 volunteers covering over 500 synagogues weekly, and none of that labour is priced here or in JFNA's estimate.
The per-person figure. Jewish population by community comes from the American Jewish Year Book 2023, Appendix A, compiled by Ira Sheskin and Arnold Dashefsky and held in the Berman Jewish DataBank. We use the 143 communities with 2,000 Jews or more, which hold 7,278,100 people, 94.6 percent of the national total. For each community we count its institutions, price them, divide by its population, and then average the 143 community figures. That average is $142.14 a person, or $853 for a family of six, and the median is $139.94. Dividing total national spending by total national population instead gives $76.10 a person, and the gap between the two is the point of Exhibit 3 rather than an error in either.
Institution counts per community are modelled, not observed. Counts rise with population at the 0.80 power for congregations and 0.85 for day schools. The sublinear form is fitted on the Heshbon Community Database's verified counts for 319 communities, which give an exponent near 0.40 for the Orthodox layer alone, then moderated upward for the full denominational set and anchored on named communities: two congregations in Binghamton at 2,400 Jews, three in Dayton at 4,000, seventy in Boston at 248,000, and 301 in New York. Allocation is closed by largest remainder so the community counts sum exactly to the national counts in Exhibit 2: 2,280 congregations, 950 day schools, 150 JCCs, 296 camps, 450 Hillel buildings, 110 elder care facilities and 200 family service offices. The community figures therefore add back to the national bill with nothing left over. Change the exponent and the slope in Exhibit 3 changes; the direction does not. Some categories are thresholds rather than curves: a community has a JCC above six thousand people and not below it, a family service office above eight thousand, an elder care facility above ten thousand. Those thresholds are why the cloud in Exhibit 3 has visible steps in it. The steps are a property of the model and also of the world, since a community of six thousand either has a community centre or it does not.
The price of an hour is derived, not asserted. An earlier version of this file used $55 an hour on the strength of one congregation reporting what it paid in 2018, which is not good enough. We build the rate now: the Bureau of Labor Statistics puts the mean wage for security guards at $20.42 an hour in May 2025, and weighting state means by Jewish population gives $20.90. Armed officers carry a premium, and the Salary.com armed benchmark of $23.00 against the all-guard mean gives 1.126. Contractors bill more than they pay: the industry benchmark is that officer pay is 67 to 75 percent of the final bill, so we divide by 0.71. Synagogue work is weekend and festival work in short blocks, and published rate cards attach a 15 to 30 percent surcharge to short assignments, so we add 22 percent. That gives $33.15 for a standing post and $40.45 for weekend coverage. Set against five other observations, including the $90,000 fully loaded guard-year the Federations reported to Congress and the $45.20 median on government security contracts, the median of seven anchors is $45.20. We use $45.00, and the 2018 Chabad figure that used to be the whole derivation is now just the highest number in the table.
How many guards is the other question, and it moves the answer more than the rate does. A building with two controlled entrances needs two officers. In March 2026, after an attacker rammed a car into a Michigan synagogue and traded fire with its single armed officer, the head of the Community Security Initiative at UJA-Federation of New York said institutions "probably have to have multiple armed guards," because an attacker who takes out the one officer has taken out the whole layer. The same body runs a reimbursement programme built around moving institutions from one guard to two. So we price posts explicitly: a large synagogue at two officers during services and three on the High Holidays, a day school at two through the school day plus a third at drop-off and pick-up when the door has to stand open, a JCC at two because you cannot watch a pool wing and a front desk from one position, and everything else at one. Costing every hour at a single guard instead would put the national bill at $431M rather than $554M, so this decision is 22 percent of the answer and lifts the bill 28 percent above a single-guard baseline, which is why we are not going to bury it. The grid of what the bill looks like at every rate and every coverage assumption, from $377M to $853M, is in the working paper.
Coverage schedules per institution type, before post counts are applied: a large congregation at Shabbat and festivals nine hours weekly, five hours of Sunday religious school, nine hours across three weekday evenings and a ninety-hour High Holiday surge, which comes to 1,934 post-hours a year once the second and third officers are counted; 744 for a medium congregation; 4,085 for a day school; 6,240 for a JCC; 2,080 for an elder care facility. A hardening package amortised over ten years. A systems, monitoring and training line.
The congregation size distribution is the weakest assumption in the file. We assume 20 percent of the congregation universe is large, 40 percent medium, and the remaining 40 percent too small to hire anyone, which is the tier excluded from scope. No published distribution of American synagogues by security coverage exists. Two named points bracket it: Temple Emanu-El in Closter, New Jersey spends $650,000 a year, fifteen percent of its budget, and a Long Island Chabad congregation runs at about $33,300.
Day schools are priced by the same formula as everything else, and the Teach Coalition survey is held out of the build entirely so it can test the result. That test is the strongest evidence in the file: the model says $253,825 a school and the survey measured $339,297 across New York, New Jersey, Pennsylvania and Florida, which is 75 percent, and low in the direction four high-cost, high-threat states should be. The internal composition matches too, guards at 72 percent modelled against 69 percent measured.
Nobody knows how many Jewish congregations there are. The 2020 US Religion Census counts 3,306, of which 953 are Chabad. The 2001 American Jewish Year Book census counted 3,727. The IRS Business Master File, filtered to active Judaism-coded organisations with congregational names, gives 4,364. The gap sits in Haredi Brooklyn, Lakewood and Rockland, where a shtiebel in a converted rowhouse is a congregation by any functional definition and appears in none of the denominational lists. The error runs the other way for everyone else, because Reform and Conservative congregations sit under their movements' group exemption rulings and are largely absent from the federal record. The IRS file shows thirty-three congregations in the Boston area.
Federal money is inside the bill, not beside it. Nonprofit Security Grant Program dollars pay for part of what institutions spend, so the $263M in Exhibit 7 sits inside the $554M national total. The Jewish share of the federal programme is estimated, not published: FEMA has never released a religion-coded award table. The best modern figure is the MPAC Center for Security, Technology and Policy analysis of July 2026, which finds 57.9 percent of $850M awarded between January 2017 and May 2026 went to Jewish communities. We apply a declining ladder from 90 percent in 2016 to 58 percent in 2024.
Insurance is not priced, because no post-2018 evidence on Jewish institutional premiums exists in any public source. The last comparable reporting is from 2002, after the eleventh of September, when premiums rose sharply and terrorism cover was withdrawn. If the same has happened since 2018 it sits on top of everything here.
Population estimates vary in age. The Appendix A community studies range from 1955 to 2023. Akron's 3,000 is a 1999 study and New York's 1,538,000 is a 2011 study, so several per-person figures rest on estimates older than the phenomenon being measured.
One finding was tested and withdrawn. We looked for evidence that security spending displaced other communal giving. A difference-in-differences on real grant dollars appeared to show it, then collapsed: 57 percent of the comparison group turned out to be foundation arms rather than operating federations, and in one size band every control was a foundation arm and every treated case a federation. Seventeen controls were the treated federation's own endowment arm in the same city. Restricted to operating federations the effect vanishes at a p of 0.762, and adding institutional type to the regression drives the coefficient to −0.21 at a p of 0.988. Nothing in this data identifies what was cut to pay for security. That does not mean nothing was.
Charts. The colour palette was validated for colour-vision deficiency and contrast against this page's surface before use. Every series is directly labelled, every figure carries a table view, and the file has a dark mode built from its own steps rather than an inverted copy.
The paper behind this story
Tell me who you are and where you work. I’ll send the complete paper.
Sent to the author directly. No list, no forwarding, no third parties.
Ḥeshbon
A data project on how Jewish life is paid for, published in full. Every figure comes from the underlying research, and where a chart simplifies a published result the piece says so.
Each piece here is published, with its own sources, sample sizes and limits stated in place. Percentages describe the samples observed, and several rest on small denominators, noted where they appear. Nothing here audits an individual institution. Aliyah figures are current as of August 2026, at roughly three shekels to the dollar, and Israeli tax and benefit rules move faster than that.