ḤeshbonCenter on Data and Jewish Life
AffordabilityFamily Economics
Affordability ← Library
Heshbon's Community Database · An affordability journey

The Frum Family Trail

One young couple, four kids, thirty-five years — 2026 to 2061, from your early 30s to your mid-60s. Set your starting point, make every call on the trail, and watch the money compound.
A modeled, illustrative journey on Heshbon's Community Database — full assumptions at the bottom of the page.
◆ The Frum Family Trail ◆
Stop 1 of 11 — choose your city2026 · age 30
Net worth · 2061
your path
You vs the benchmark
difference by 2061
Liquid savings · 2061
investable, outside the house
Spent raising + educating
childcare, tuition, camp, Israel, college
Your path The typical family Net worth = investments + home equity · nominal $
Where the money goes each year · stacked bands sum to total spending; the line is your take-home income · nominal $

🧭 The trail of decisions

MAZEL TOV · 2061

🏁 You've reached 2061.

Net worth
vs benchmark
Biggest single lever

💵 What it's worth in 2026 purchasing power

The nominal column is dollars in the year they occur. The 2026 column deflates each figure by 2.5%/yr inflation, so you can read your 2061 results in today's buying power. (This mirrors the Nominal ↔ Today's-$ toggle up top.)

FigureNominalIn 2026 dollarsInflation drag

How the model works. One household is simulated year by year for 35 years — the couple begins around age 30 and ends near 65. You set the starting combined salary and the higher earner's share; both incomes grow 3%/yr with promotion bumps (years 6, 14, 22 for the higher earner; 10, 18 for the lower), a part-time parent trims the smaller paycheck in the baby years, and your wind-down choice cuts late-career income. Four children arrive in years 1, 3, 6 and 9. Each year subtracts income tax (federal + state), the mortgage, property tax, car ownership, childcare & preschool, K-12 tuition (net of a 15% aid discount and any state ESA voucher), summer camp, a year in Israel, college, weddings, and everyday living; the surplus is invested at ~5.5%/yr and the home appreciates at a sustainable long-run rate (~4% Memphis, ~2.8% West Hartford — deliberately far below the 2015–2025 boom, so a Memphis home stays realistic rather than ballooning past $3M). Homes scale by bedroom count (3BR base, 4BR ×1.28, 5BR ×1.62). Cars cost ~$9k/yr each new, ~$5.5k used, ~$3.5k kept long, with a third car once a teen is driving. Net worth = investments + home equity. The today's-dollars view deflates every figure by 2.5%/yr inflation to 2026 buying power. City cost structure is from Heshbon's Community Database; camp, Israel-year, college, car and wedding costs are modeled estimates. Figures are illustrative.

Show the data table (both paths, every 5 years)

Source: Heshbon's Community Database; Zillow Home Value Index (2015–2025, used only to anchor relative city appreciation); milestone costs modeled per typical Orthodox community ranges.

Assumptions. Home prices are a minimum for a single-family starter near the shuls, from 2026 Zillow values (East Memphis ~$430k · Toms River ~$500k · West Hartford ~$535k · Lakewood ~$600k · Boca ~$650k · Teaneck ~$700k); near-shul single-family homes run higher. Long-run appreciation is set to sustainable nominal rates (~3–3.8%), well below the 2015–2025 boom. Tuition varies by community (Lakewood cheapest, Teaneck priciest). Camp, Israel-year, college, car and wedding costs are modeled estimates. Illustrative, not a forecast.

The paper behind this story

The Frum Family Trail

Methodology

Methodology paper · 2026 · Ħeshbon · Center on Data and Jewish Life

Methods Download the methodology companion (PDF)
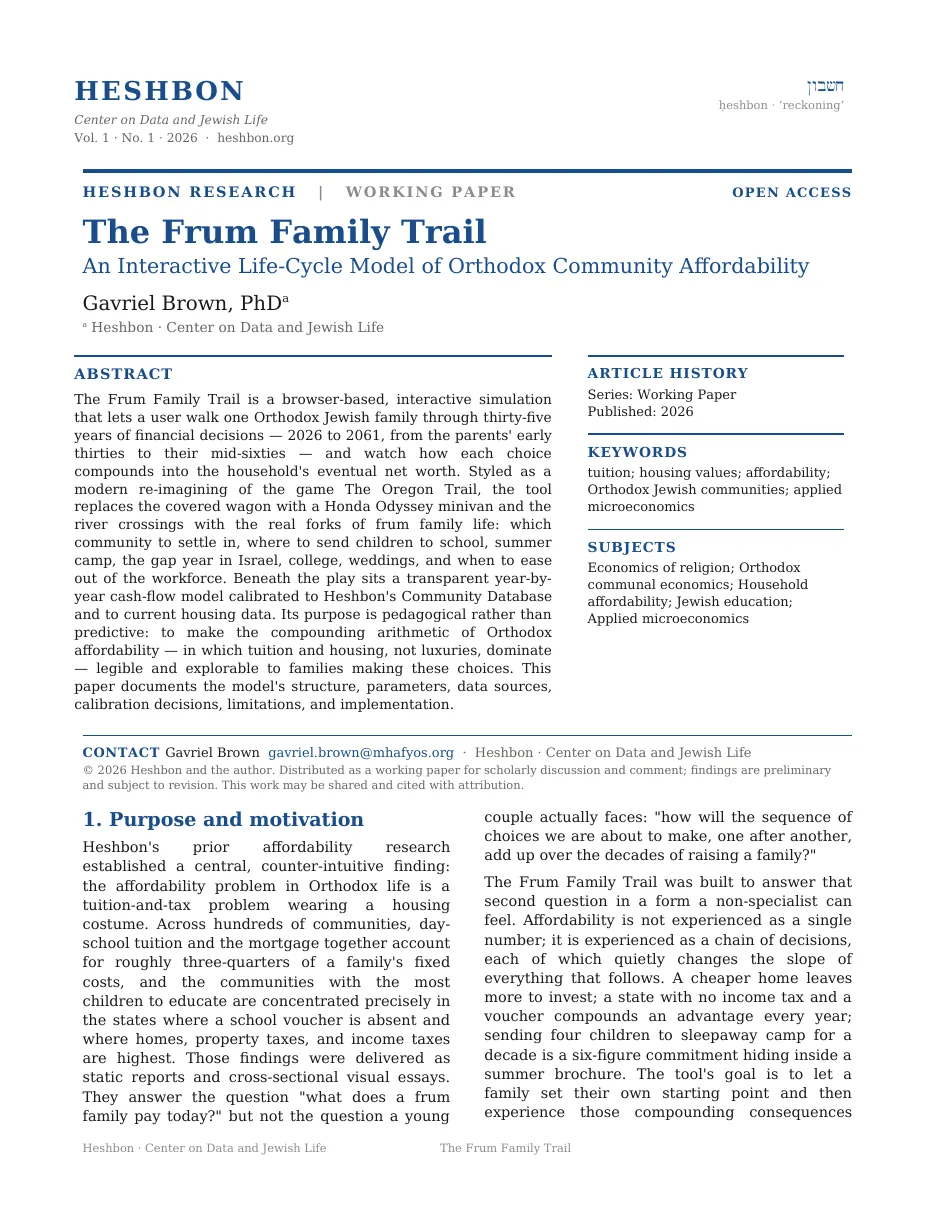
First page of the whitepaper The Frum Family Trail

Request the full whitepaper

Tell me who you are and where you work. I’ll send the complete paper.

Sent to the author directly. No list, no forwarding, no third parties.