Three and a half centuries of Jews in America, in three minutes
Twenty-three refugees reached New Amsterdam in 1654, and a 2024 county-by-county count puts American Jews at 7.7 million.
Play and scrub
Press Play, or drag the slider to any moment. The colonial era goes by fast, and from 1899 on the film moves at about a year per second, for about three minutes in all. If your device is set to reduce motion, the Play button disappears and you move through the years with the slider.
Spikes
Before 1877 each spike stands for a town. From 1877 each one stands for a state, and in 2024 the states break apart into counties. The scale tightens as the population grows, so the dashed spike at the right shows what 10,000 or 100,000 people look like at that moment. Starting in 1899, a spike's color gives its state's rate of change per decade, with the key on screen.
Lines and rings
Pink lines show arrivals from abroad, drawn in from the direction the migrants came: Europe from the right, the Soviet Union from the upper right, the Caribbean from the lower right. The direction gives the region they left and says nothing about the route they took. Violet rings mark change within the country, and the places named in the caption are set in the same violet.
The band and the sources
The band along the bottom names the latest event or law and marks every wave and event on the timeline, with the current wave of immigration in color. Every caption and event shows its source on screen. Below the film, click a document to enlarge it, or use View the original to open it at the library that holds it.
Three layers of evidence
Before 1877 the map is a reconstruction, and the screen says so. From 1877 through 2023 every spike rests on a count, starting with the first national census of American Jews in 1877 and continuing with the Year Book's state tables from 1899 to 2023. In 2024 the states give way to the county-based estimate of Comenetz and Sheskin. Between benchmark years the spikes move in straight lines, since nobody counted in between.
How the early map was rebuilt
The national totals follow the published series: 25 in 1654, about 1,500 in 1776, 3,800 in 1820, 15,000 in 1840, 175,000 in 1860 and 229,082 in the 1877 count. Where a source gives a range, the film draws a central value. Until 1820 we divided the total among the colonial ports by hand, using early city figures and standard accounts. Between 1820 and 1840 a model takes over, in which each of the 170 towns in the 1877 table appears in its settlement year and grows toward its 1877 size, with the sum held to the national total. From 1877 to 1899 the states are scaled so that they add up to the national estimates.
Counts and surveys disagree
The Year Book added up local estimates, while the national surveys sampled households. The National Jewish Population Surveys found 5.5 million in 1990 and 5.2 million in 2000-01, but the Year Book's compilation for 2000 came to 6,136,950. Pew counted 6.7 million in 2013 and 7.5 million in 2020. The gaps come down to who gets counted as Jewish, so the film sticks to one series and names the others in its notes.
The film's last step is partly a change of method. The 2023 Year Book, the last one done the old way, totals 7,460,600. The 2024 county estimate totals 7,698,840, and its authors put the rise down to the method rather than to growth.
Where the map moved
In 1960 the Northeast held 66.6 percent of American Jews. Its share was 46.1 percent by 2000 and 40.7 percent in 2024, while the region holds 17.0 percent of all Americans. Over the same span the South rose from 8.8 to 24.1 percent and the West from 10.8 to 23.6, and the Midwest slipped from 13.8 to 11.7. New York State by itself went from 45.8 percent of American Jews (2,533,900 people) to 21.7 percent (1,672,025).
Between 2000 and 2023 the Year Book series barely moves the Northeast, from 46.1 to 44.6 percent, and then the 2024 county method drops it to 40.7 in a single step. The long decline looks real to us. The 2000 to 2023 series seems slow to pick it up, and these data can't tell us when the catch-up happened.
What the film cannot show
The United States doesn't record births and deaths by religion, so there's no way to separate natural increase from migration. The spikes show an estimate at each date and don't follow anyone over time. Even the 1877 count disagrees with itself in small ways: its state rows add up to 229,082, Linfield's later review gives 229,087, and the 170 towns sum to 200,408.
The sourcesHow do we know all this?
This section gives the source for everything in the film, along with the documents we could reproduce, the counts the map rests on and a reading list.
The documents
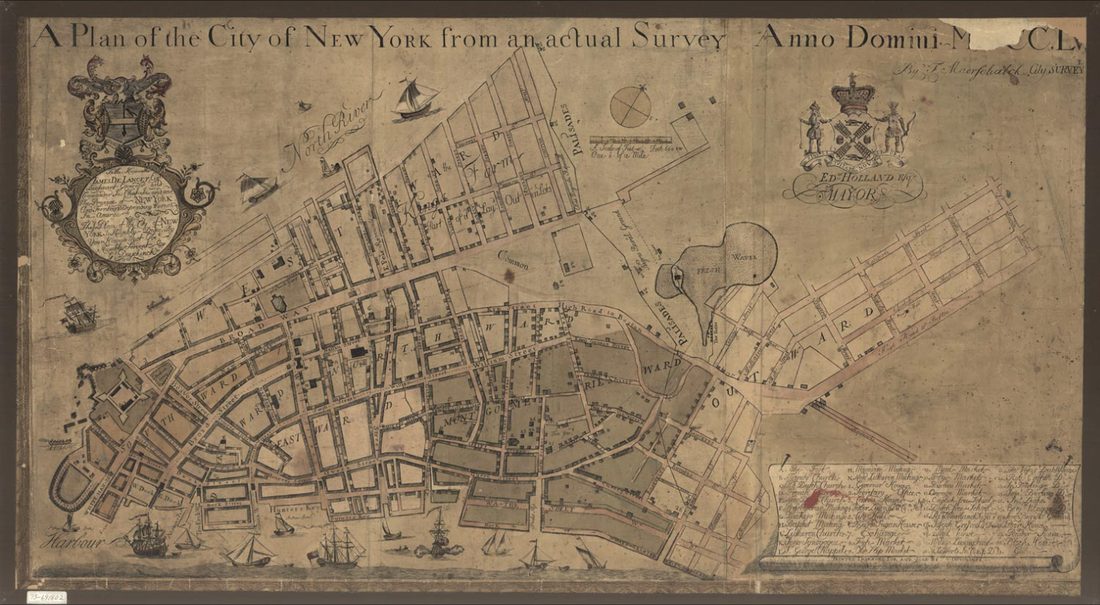
Manuscripts, a map, a magazine, a photograph and newspapers of the day, held by the Library of Congress and the American Jewish Historical Society. Click one to enlarge it.
 1790
 1790
 1755
 1763
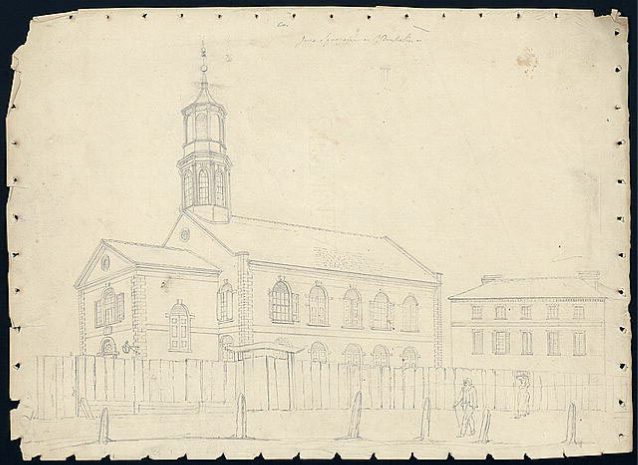 c. 1812
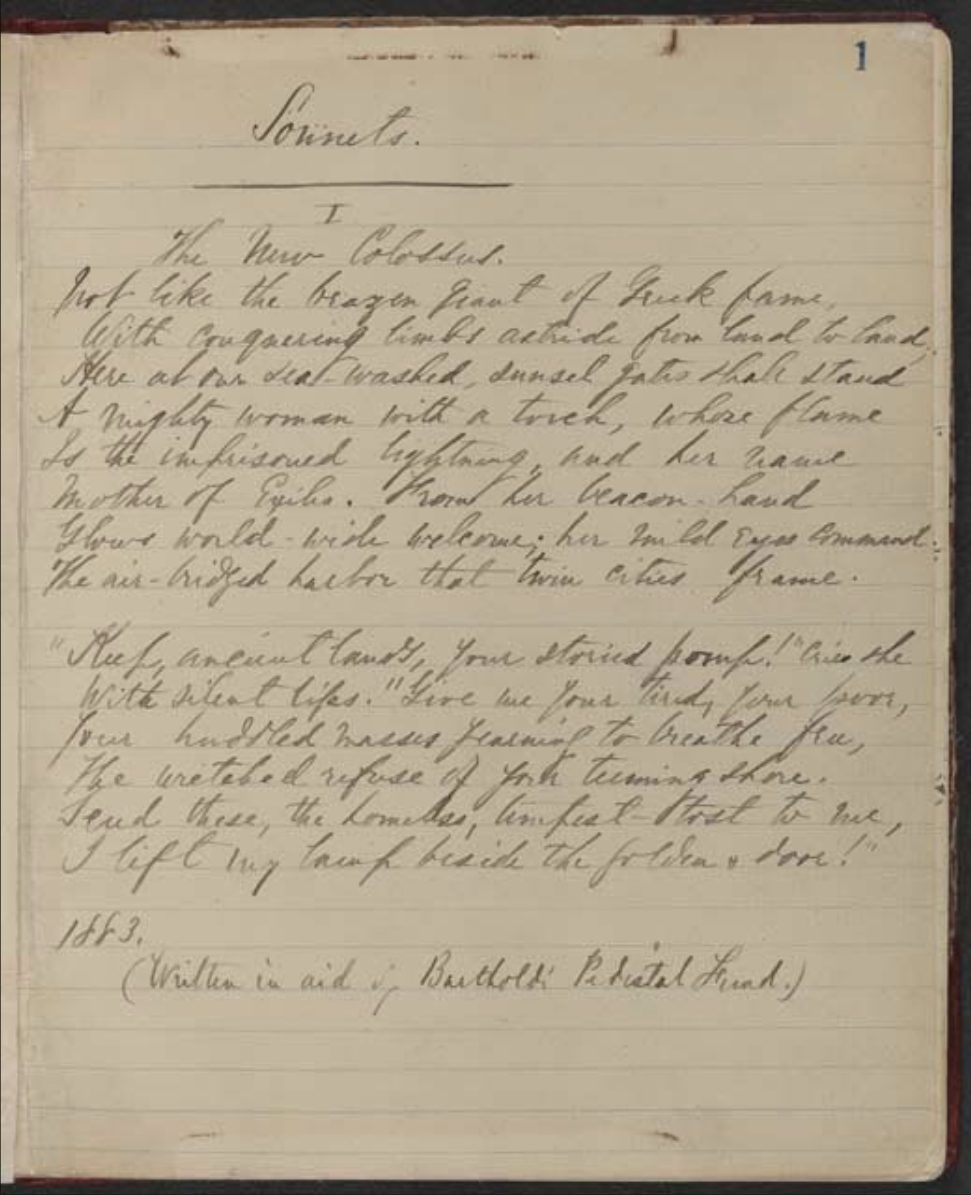 1883
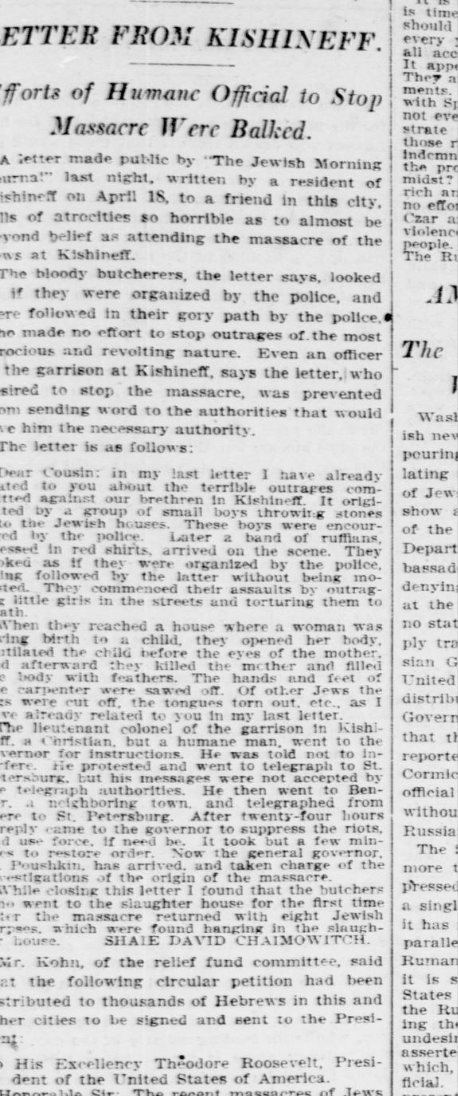 1903
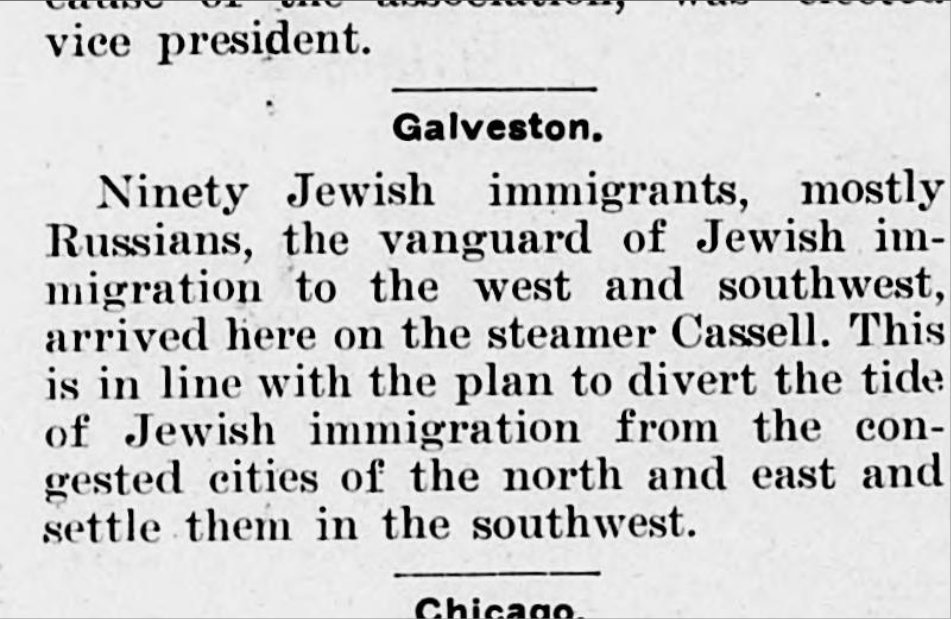 1907
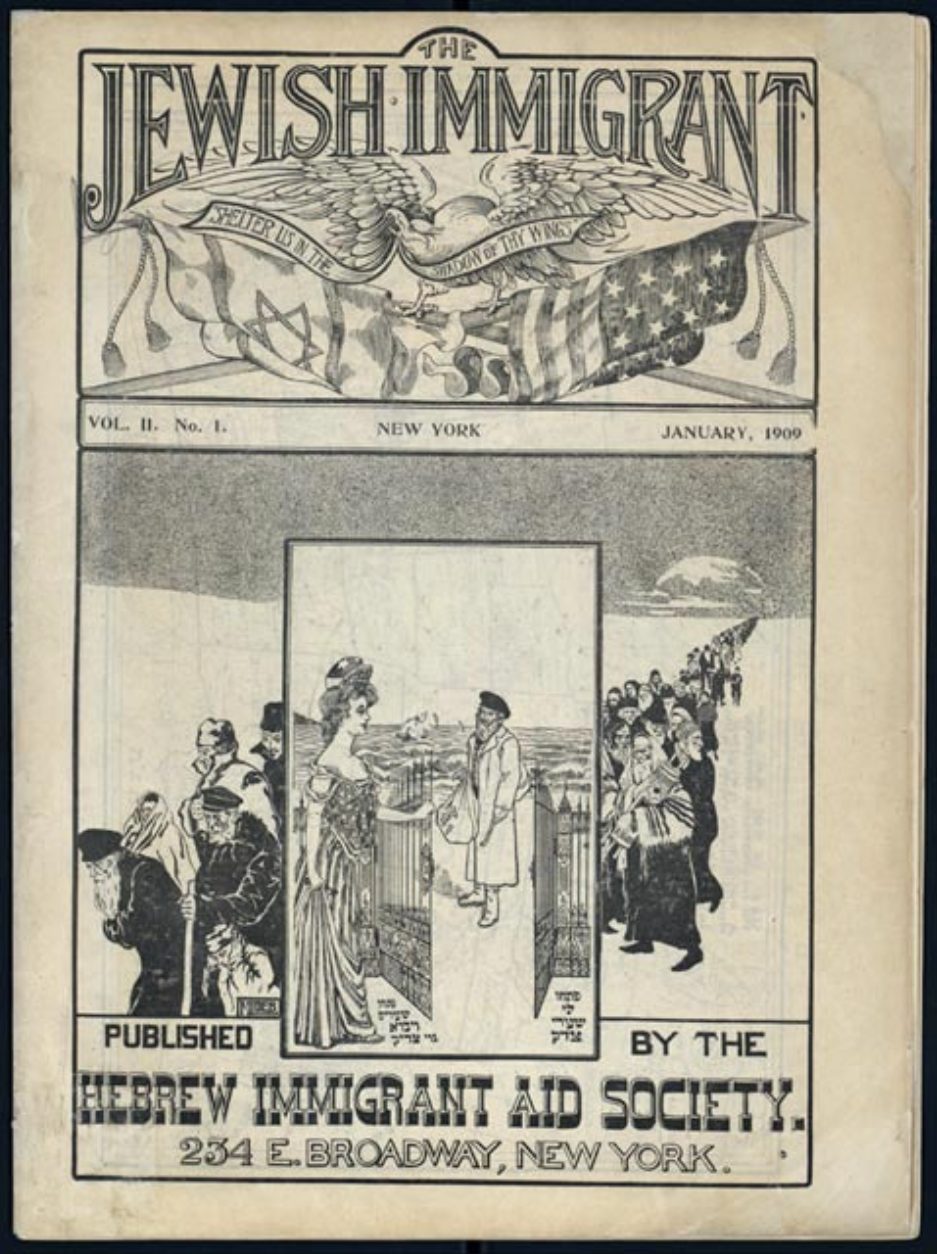 1909
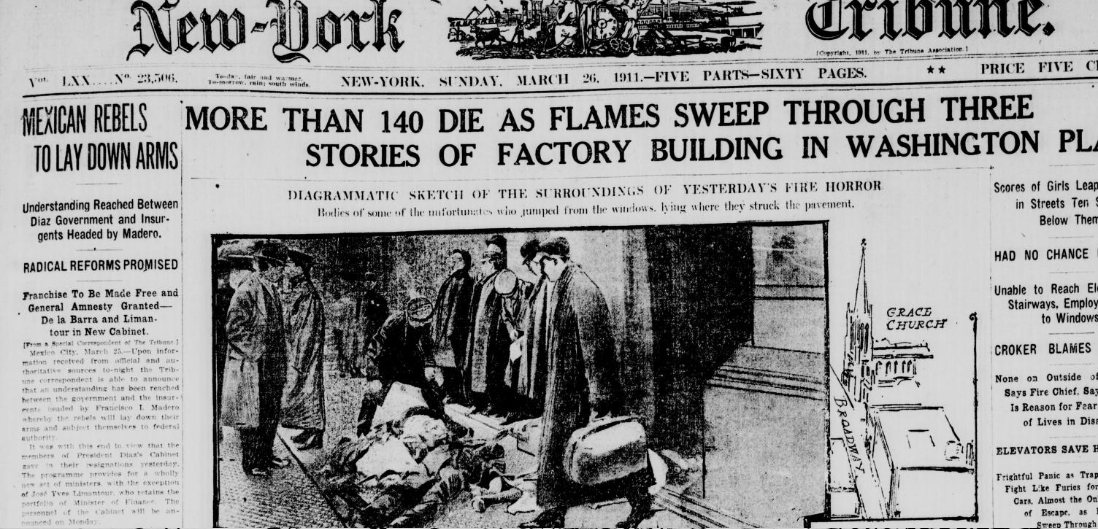 1911
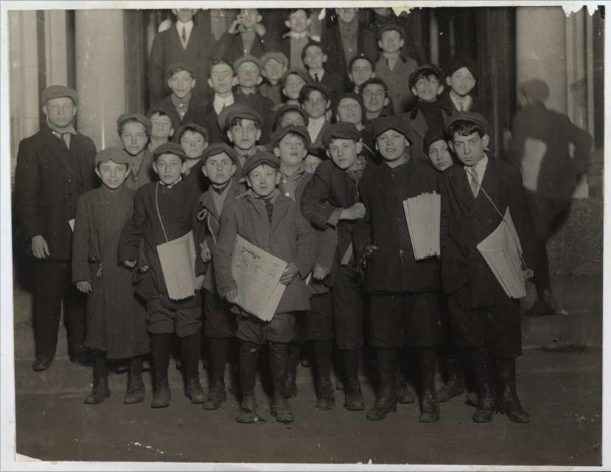 1913
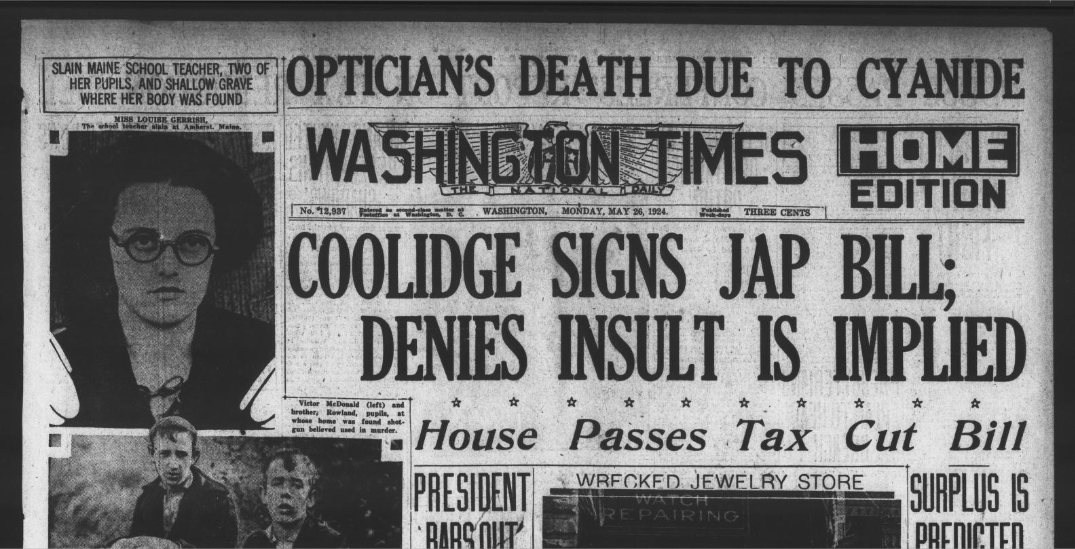 1924
The counts the map stands on
Each card covers one benchmark and links the study behind it, along with the scholarship that evaluates it.
- scholarshipThe golden jubilee of the first NJPS: a critical assessment, 1970 to 2020 (AJYB 2022)
- scholarshipNJPS 2000 to 01: a guide for the perplexed (Contemporary Jewry)
- scholarshipBeyond the 1990 NJPS: a research agenda (Contemporary Jewry)
- repositoryBefore Pew: debating the future of U.S. Jews in earlier times (reader's guide, Berman Jewish DataBank)
Fact by fact
Every caption and event in the film, in order, with where it comes from.
| Year | What the film says | Where it comes from |
|---|---|---|
| The colonial haven, 1654 to 1820 | ||
| 1654 | Twenty-three refugees from Recife, by way of the Caribbean, land in New Amsterdam. | |
| 1690 | The first communities grow in the port towns of Newport, Charleston and Philadelphia, settled by traders from London, Amsterdam and the Caribbean. |
|
| 1730 | Shearith Israel builds the first synagogue in North America, on Mill Street. |
|
| 1733 | Forty-two Jews from London land at Savannah on July 11, 1733. |
|
| 1740 | The Plantation Act lets Jews in the British colonies naturalize. |
|
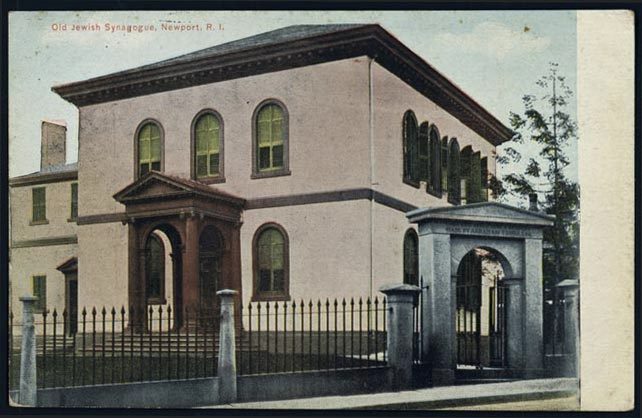
| 1763 | Touro Synagogue is dedicated in Newport. |
|
| 1776 | Perhaps 1,500 Jews at independence, most of them in five Atlantic ports. The published range runs from 1,000 to 2,500. |
|
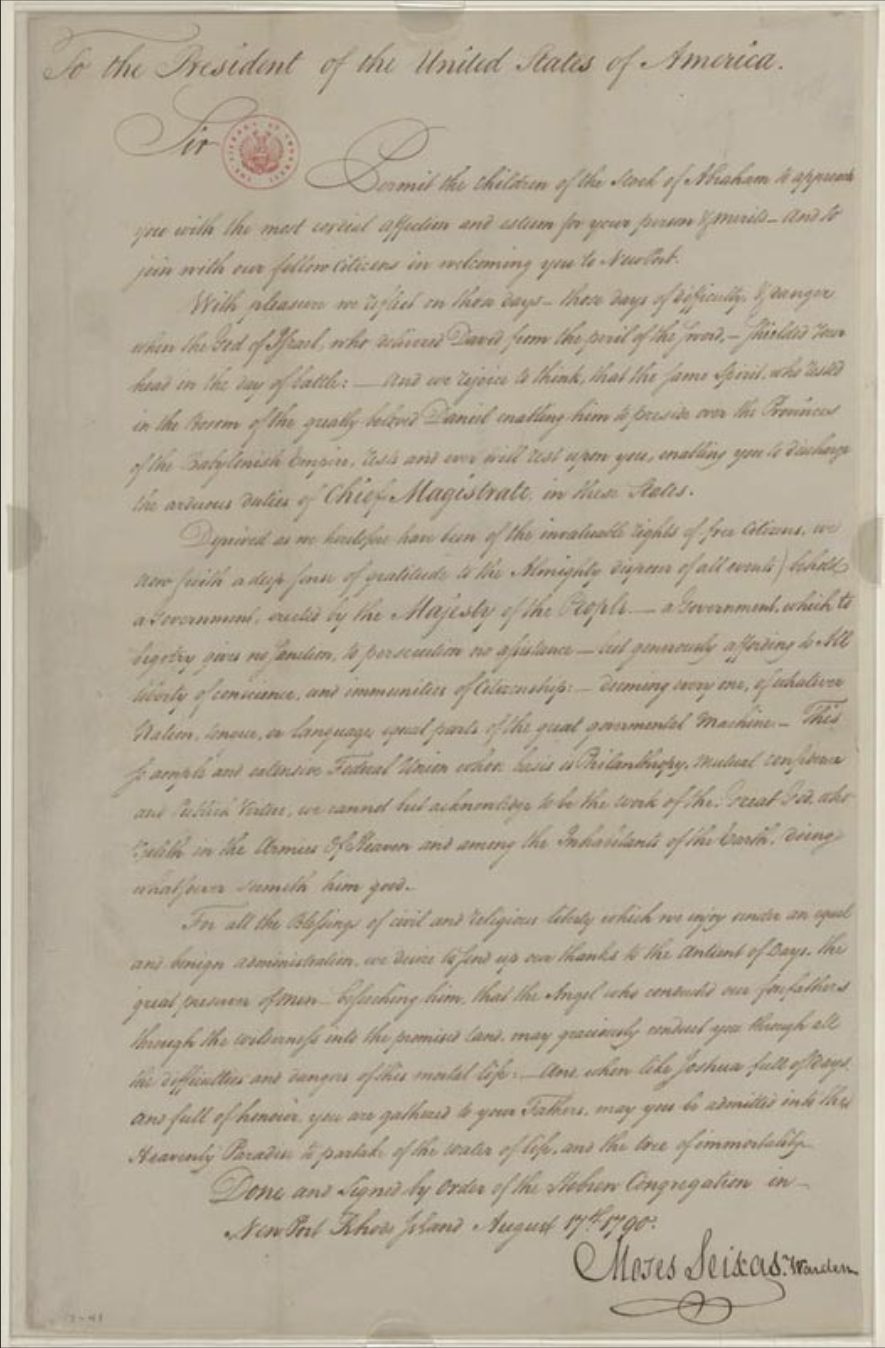
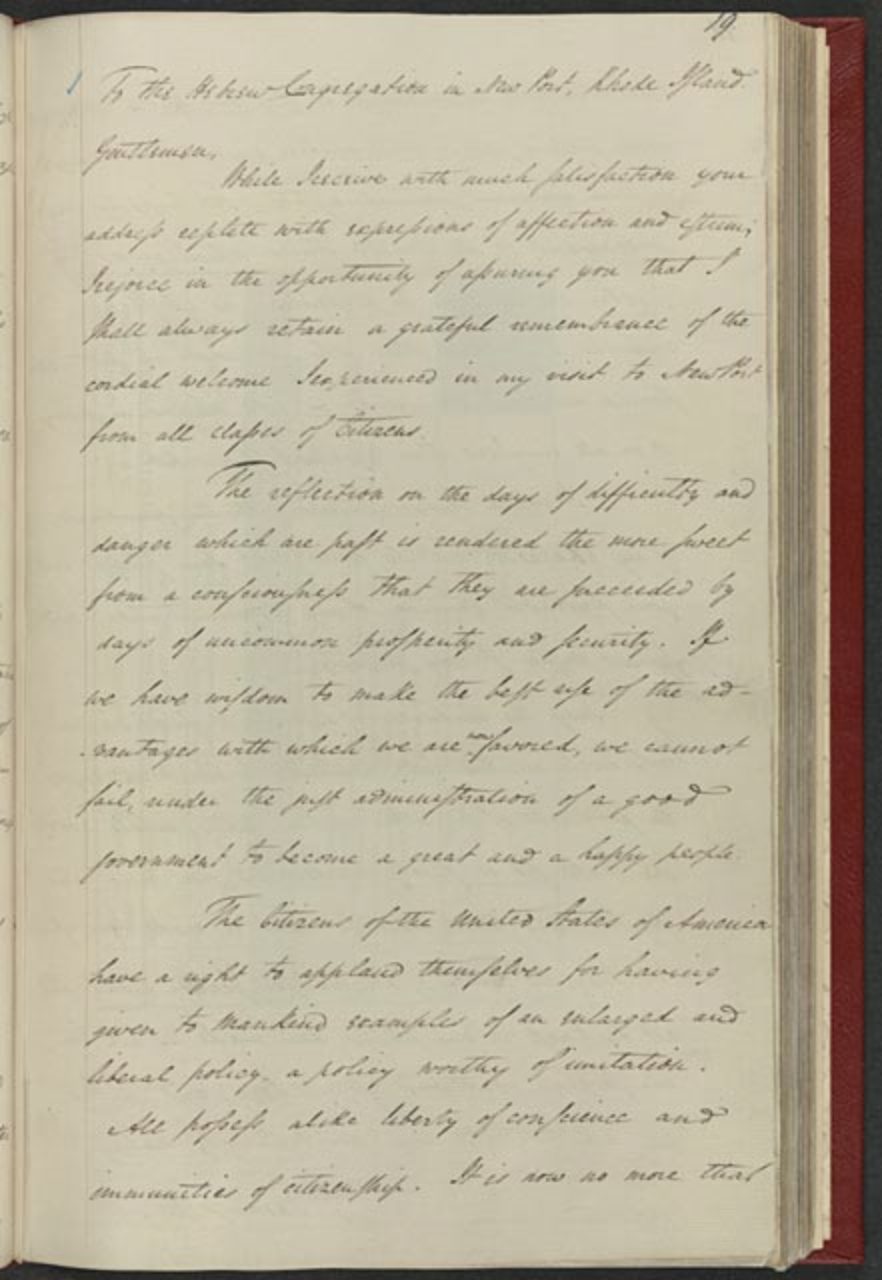
| 1790 | Washington writes to the Newport congregation that the government "gives to bigotry no sanction, to persecution no assistance." |
|
| 1795 | Charleston, with about 500 Jews, is the largest community in the young republic, and it reaches 700 by 1820. |
|
| The German wave, 1820 to 1880 | ||
| 1820 | Central European Jews begin arriving in numbers, and peddlers and merchants follow the rivers to Cincinnati, St. Louis and New Orleans. | |
| 1824 | The Reformed Society of Israelites in Charleston begins American Reform Judaism. |
|
| 1834 | Congregations mark the trail west: Cincinnati 1824, St. Louis 1837, Chicago 1847. |
|
| 1838 | Rebecca Gratz opens the first Hebrew Sunday school, in Philadelphia. |
|
| 1843 | B'nai B'rith is founded on the Lower East Side. |
|
| 1848 | Revolution in Europe speeds the migration, and San Francisco and Chicago grow from nothing. | |
| 1862 | Grant's Order No. 11 expels Jews from his military district, and Lincoln revokes it. | |
| 1866 | After the Civil War some 200,000 Jews spread through 170 towns, and a third of those towns count fewer than a hundred. | |
| 1873 | The Union of American Hebrew Congregations is founded in 1873, and Hebrew Union College in 1875. |
|
| 1877 | The Board of Delegates and the UAHC count 229,082 Jews, a third of them in New York. | |
| The East European wave, 1881 to 1924 | ||
| 1881 | Pogroms in the Russian Empire open the great migration, and the refugees reach New York in 1882. | |
| 1882 | The first general federal immigration law imposes a head tax and exclusions. | |
| 1886 | The Statue of Liberty is dedicated. Lazarus's 1883 sonnet goes on the pedestal in 1903. | |
| 1890 | Half a million Jews by 1890, as Chicago, Philadelphia and Boston swell. |
|
| 1892 | Ellis Island opens on January 1. | |
| 1897 | The Forverts begins publishing. | |
| 1899 | One million Jews in 1899, four in ten of them in New York State. | |
| 1903 | After the Kishinev pogrom, emigration surges. |
|
| 1907 | New York passes 900,000, half of American Jewry, and the Lower East Side holds over 500,000 Jews by 1910. | |
| 1907 to 1914 | The Galveston plan lands 10,000 immigrants in Texas, and from 1901 to 1922 the Industrial Removal Office sends 79,000 out of New York. |
|
| 1911 | The Triangle fire kills 146 garment workers. | |
| 1914 | The war cuts the flow, and the Joint Distribution Committee is founded. |
|
| 1917 | Jews number 3.4 million by 1917, the year the literacy test becomes law. | |
| 1921 and 1924 | The Emergency Quota Act and the Johnson-Reed Act close the gate. | |
| 1927 and 1937 | 4.2 million in 1927 and 4.8 million in 1937, with 2.2 million of them in New York. | |
| Refugees, survivors and the postwar map, 1933 to 1965 | ||
| 1933 to 1941 | At least 110,000 Jewish refugees reach America from Nazi Europe. | |
| 1939 | The St. Louis is turned away. | |
| 1945 to 1952 | 35,000 to 40,000 displaced persons under the Truman directive, then about 80,000 Jewish DPs under the 1948 act. | |
| 1946 | Miami grows from 9,000 Jews in 1940 to 134,000 by 1960, most of them from the Northeast and Midwest, while Los Angeles booms. | |
| 1957 | California is second at 514,000 and Florida crosses 100,000. The Census asks about religion. | |
| 1965 | Hart-Celler ends the national-origins quotas. New York peaks near 2.5 million, and Florida more than doubles in the sixties. | |
| Sun Belt, Soviet Jews and the new counts, 1970 to 2024 | ||
| 1974 | New York begins to thin, with nearly 400,000 fewer Jews by 1980, and Jackson-Vanik ties trade to Soviet emigration. | |
| 1980 | After 1979, some 60,000 to 80,000 Iranian Jews come to America, most to greater Los Angeles. | |
| 1986 | Florida, California, Arizona and Georgia climb through the eighties. | |
| 1989 to 2000 | The Soviet Union opens its doors and the Lautenberg Amendment eases refugee admission. From 1971 on, some 400,000 Soviet and post-Soviet Jews and their families arrive. | |
| 1990 and 2001 | NJPS 1990 counts 5.5 million and reports 52 percent intermarriage. NJPS 2000 to 01 counts 5.2 million against the Year Book's 6.1 million. | |
| 1997 and 2002 | Pennsylvania, Ohio and Missouri each lose a fifth or more between 1970 and 1990. By 2000 New York holds just over a quarter of American Jews. |
|
| 2008 | California passes 1.2 million, while Georgia, Colorado and Virginia keep rising. | |
| 2011 to 2014 | New York turns upward, with 1.54 million in the metro area, up 9 percent since 2002. Of the area's Jewish children, 61 percent live in Orthodox homes. | |
| 2013 and 2020 | Pew counts 6.7 million, then 7.5 million. | |
| 2012 to 2023 | Pennsylvania gains 139,000 and New Jersey 124,000 between the estimates, and Washington rises 71 percent. | |
| 2024 | A county-by-county count finds 7.7 million in 1,545 counties. | |
Reading list
Reference works
- Encyclopaedia Judaica, second edition, "United States of America" (Encyclopedia.com)
- Encyclopaedia Judaica, "Galveston Plan" and "Kishinev" (Encyclopedia.com)
- The Jewish Encyclopedia (1901 to 1906), "Statistics"
- YIVO Encyclopedia of Jews in Eastern Europe
- Jewish Virtual Library, Jewish population in the United States by year
- Goldring/Woldenberg Institute of Southern Jewish Life, Encyclopedia of Southern Jewish Communities
- Handbook of Texas Online
- New Georgia Encyclopedia
- Jewish Women's Archive, Shalvi/Hyman Encyclopedia
- United States Holocaust Memorial Museum, Holocaust Encyclopedia
Books and articles
- Jonathan D. Sarna, American Judaism: A History (Yale, 2004)
- Jonathan D. Sarna, When General Grant Expelled the Jews (Schocken, 2012)
- Hasia R. Diner, The Jews of the United States, 1654 to 2000 (California, 2004)
- Jacob Rader Marcus, To Count a People: American Jewish Population Data, 1585 to 1984 (1990)
- Ira Rosenwaike, "An Estimate and Analysis of the Jewish Population of the United States in 1790," PAJHS 50 (1960), JSTOR
- Ira Rosenwaike, "The Jewish Population of the United States as Estimated from the Census of 1820," AJHQ 53 (1963), JSTOR
- Uriah Z. Engelman, "Jewish Statistics in the U.S. Census of Religious Bodies, 1850 to 1936," Jewish Social Studies 9 (1947), JSTOR
- Moses Rischin, The Promised City: New York's Jews, 1870 to 1914 (Harvard, 1962)
- Deborah Dash Moore, To the Golden Cities: Pursuing the American Jewish Dream in Miami and L.A. (1994)
- Steven J. Gold, "Soviet Jews in the United States," American Jewish Year Book 1994
- Mark Tolts, A Half Century of Jewish Emigration from the Former Soviet Union (Davis Center, Harvard, 2020)
- "Leaving the Enclave: Historical Evidence on Immigrant Mobility from the Industrial Removal Office," Journal of Economic History
- "Numbering Israel: The U.S. Census and Religious Organizations," Social Science History
- Kosmin, Ritterband and Scheckner, "Counting Jewish Populations: Methods and Problems," AJYB 1988
- "Was it the demography? A reassessment of U.S. Jewish population estimates, 1945 to 2001," Contemporary Jewry
- "The Golden Jubilee of the First National Jewish Population Survey," American Jewish Year Book 2022
Repositories
- Berman Jewish DataBank (every Year Book population chapter, the local studies, NJPS and the 2024 county estimates)
- American Jewish Year Book, 1899 to 2008, at the AJC Archives
- Library of Congress, From Haven to Home: 350 Years of Jewish Life in America
- Library of Congress, Chronicling America: historic American newspapers
- Center for Jewish History, ArchivesSpace (AJHS, YIVO, Leo Baeck)
- HathiTrust Digital Library
- Internet Archive
- govinfo, United States Statutes at Large
- JSTOR